What are the Key Highlights of the Multidimensional Poverty Index in India Since 2005-2006? - Social Issues | UPSC Learning
Topics
0 topics • 0 completed
🔍
No topics match your search
What are the Key Highlights of the Multidimensional Poverty Index in India Since 2005-2006?
Medium⏱️ 8 min read
social issues
📖 Introduction
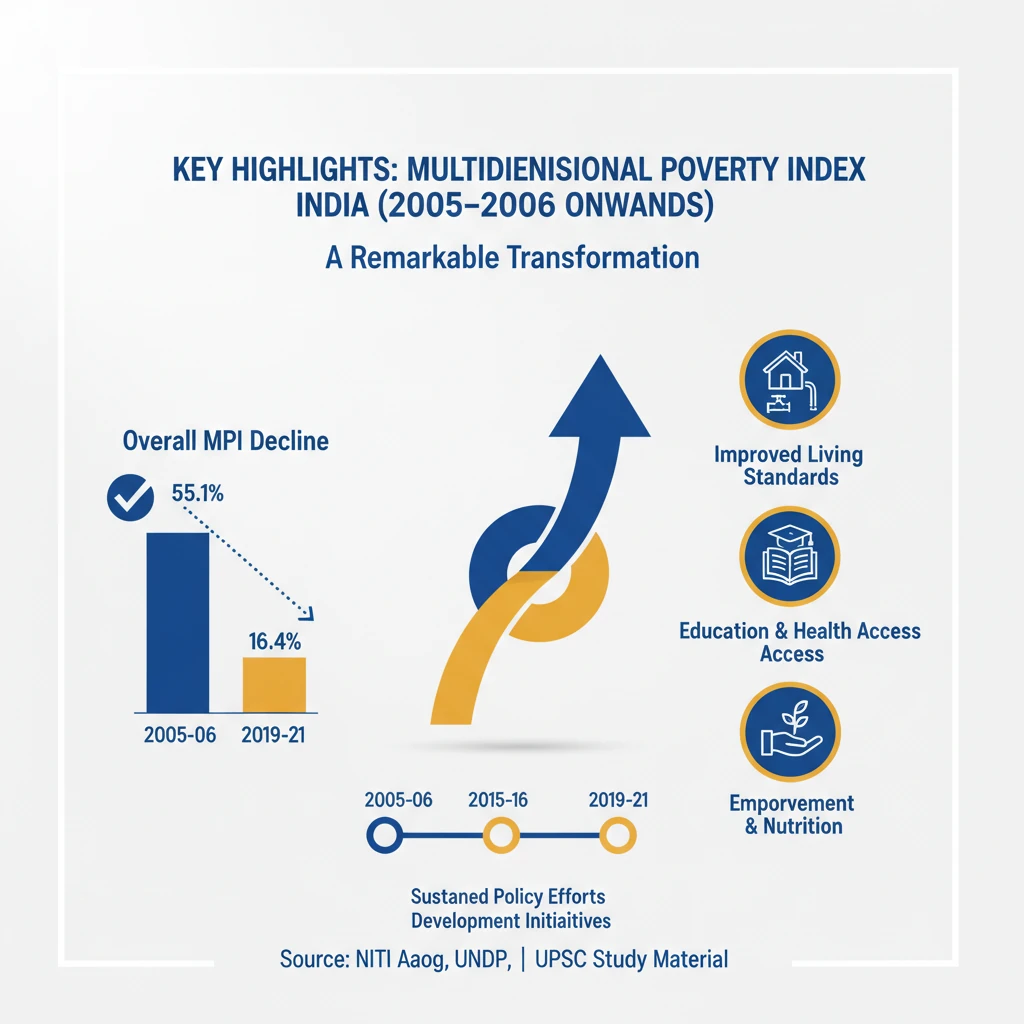
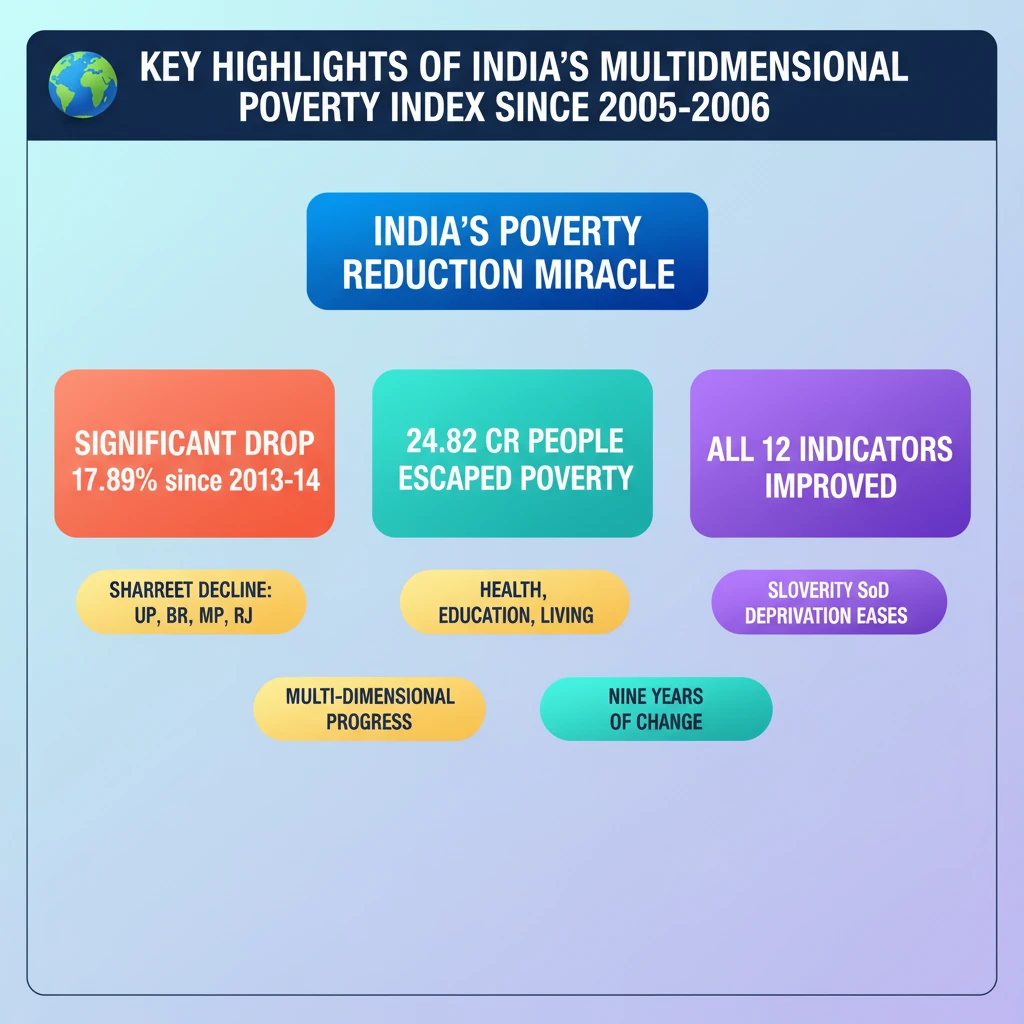
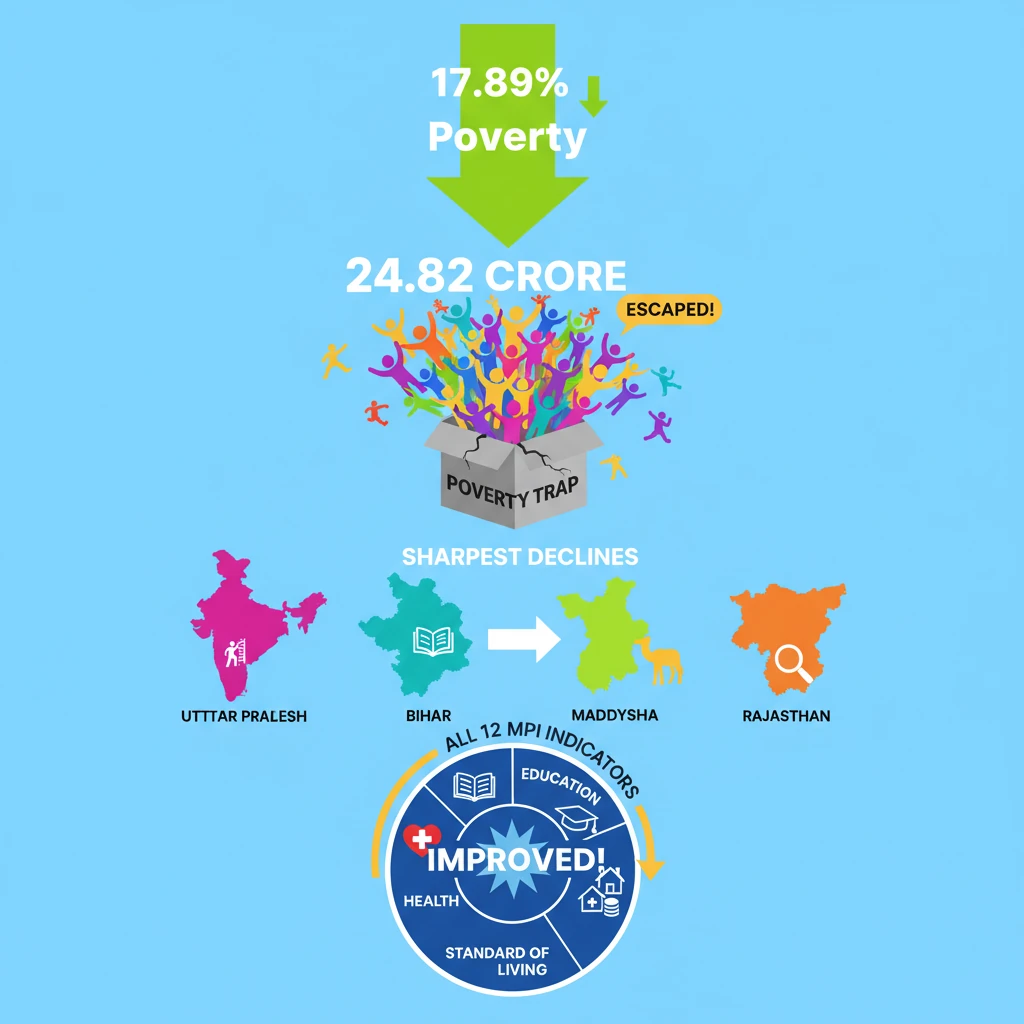
<h4>Overview of Multidimensional Poverty Reduction in India</h4><p>India has achieved a remarkable reduction in <strong>multidimensional poverty</strong> since <strong>2005-2006</strong>, demonstrating significant progress across various indicators. This decline highlights the effectiveness of sustained policy efforts and developmental initiatives.</p><h4>Overall Decline in Multidimensional Poverty</h4><p>The nation has witnessed a substantial decrease in its <strong>Multidimensional Poverty Index (MPI)</strong>. This reduction signifies a positive shift in the living standards and well-being of a large segment of the population.</p><div class='info-box'><ul><li><strong>MPI Reduction (2013-14 to 2022-23):</strong> From <strong>29.17%</strong> to <strong>11.28%</strong>.</li><li><strong>Total Decrease:</strong> A significant <strong>17.89% points</strong>.</li><li><strong>People Escaping Poverty:</strong> Approximately <strong>24.82 crore people</strong> have moved out of multidimensional poverty in the last <strong>nine years</strong> (<strong>2013-14 to 2022-23</strong>).</li></ul></div><p>This positive trajectory is largely attributed to various <strong>government initiatives</strong> aimed at improving social and economic indicators across the country.</p><h4>State-wise Performance in Poverty Reduction</h4><p>Several states have played a pivotal role in driving this national reduction, showcasing concentrated efforts and impactful policy implementation at the regional level.</p><div class='key-point-box'><p>The states recording the sharpest decline in the number of people classified as poor based on the <strong>MPI</strong> are: <strong>Uttar Pradesh</strong>, <strong>Bihar</strong>, <strong>Madhya Pradesh</strong>, and <strong>Rajasthan</strong>.</p></div><ul><li><strong>Uttar Pradesh:</strong> Recorded the largest decline, with <strong>5.94 crore people</strong> escaping multidimensional poverty.</li><li><strong>Bihar:</strong> Followed with <strong>3.77 crore people</strong> moving out of poverty.</li><li><strong>Madhya Pradesh</strong> and <strong>Rajasthan:</strong> Also showed substantial improvements.</li></ul><h4>Improvement Across All MPI Indicators</h4><p>The progress is not confined to a few areas but is broad-based, indicating holistic development. This comprehensive improvement reflects a concerted effort to address various facets of deprivation.</p><div class='info-box'><p>All <strong>12 indicators</strong> of the <strong>Multidimensional Poverty Index</strong> have shown significant improvement. These indicators span the critical dimensions of <strong>Health</strong>, <strong>Education</strong>, and <strong>Standard of Living</strong>.</p></div><div class='exam-tip-box'><p>Understanding the <strong>12 indicators</strong> and their improvement is crucial for Mains answers, especially in <strong>GS Paper I (Society)</strong> and <strong>GS Paper II (Social Justice)</strong>. Mentioning specific dimensions like <strong>Health</strong>, <strong>Education</strong>, and <strong>Standard of Living</strong> adds depth to your analysis.</p></div><h4>Trends in Severity of Deprivation (SoD)</h4><p>The <strong>Severity of Deprivation (SoD)</strong> provides insights into the intensity of poverty, measuring the average deprivations suffered by multidimensionally poor individuals.</p><div class='info-box'><p>The <strong>Severity of Deprivation (SoD)</strong> declined at a slightly lower rate between <strong>2015-16</strong> and <strong>2019-21</strong> compared to the earlier period of <strong>2005-06</strong> and <strong>2013-14</strong>.</p></div><p>This trend suggests that while overall poverty is reducing, tackling the deepest forms of deprivation might require more targeted and intensified interventions in the recent period.</p>
💡 Key Takeaways
- •India saw a significant 17.89% point reduction in multidimensional poverty from 2013-14 to 2022-23.
- •Approximately 24.82 crore people escaped multidimensional poverty in the last nine years.
- •Uttar Pradesh, Bihar, Madhya Pradesh, and Rajasthan recorded the sharpest declines.
- •All 12 MPI indicators, across Health, Education, and Standard of Living, showed improvement.
- •Severity of Deprivation (SoD) declined, though at a slightly slower rate in recent years.
🧠 Memory Techniques
95% Verified Content