How La Nina and El Nino are Predicted? - Geography | UPSC Learning
Topics
0 topics • 0 completed
🔍
No topics match your search
How La Nina and El Nino are Predicted?
Medium⏱️ 8 min read
geography
📖 Introduction
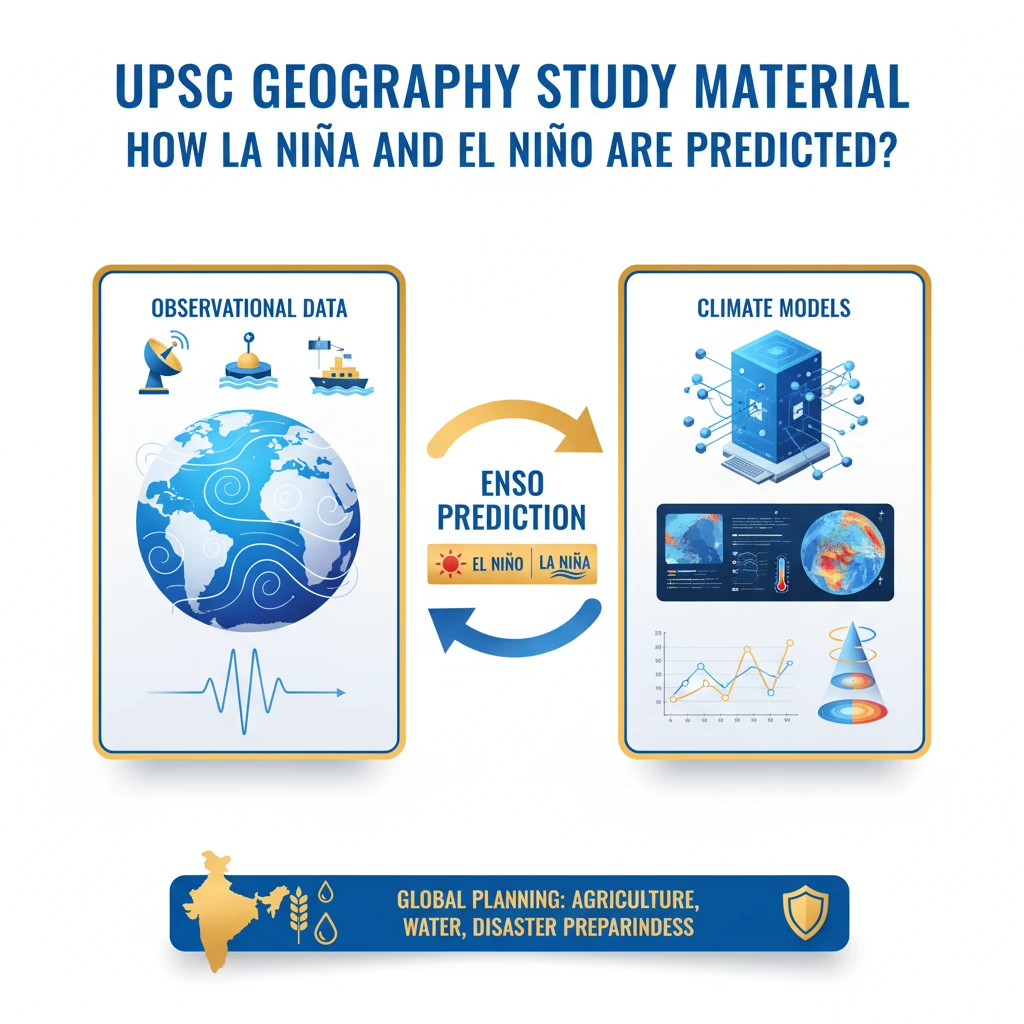
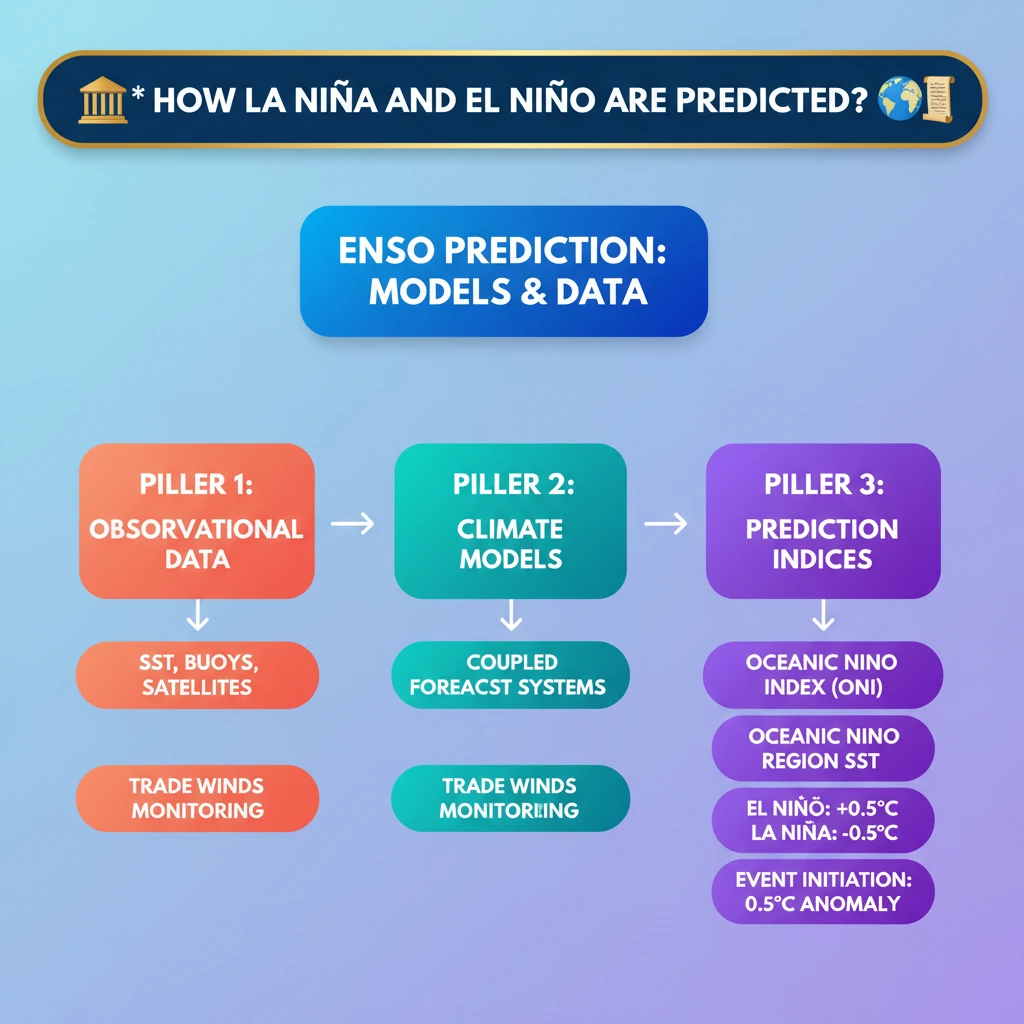
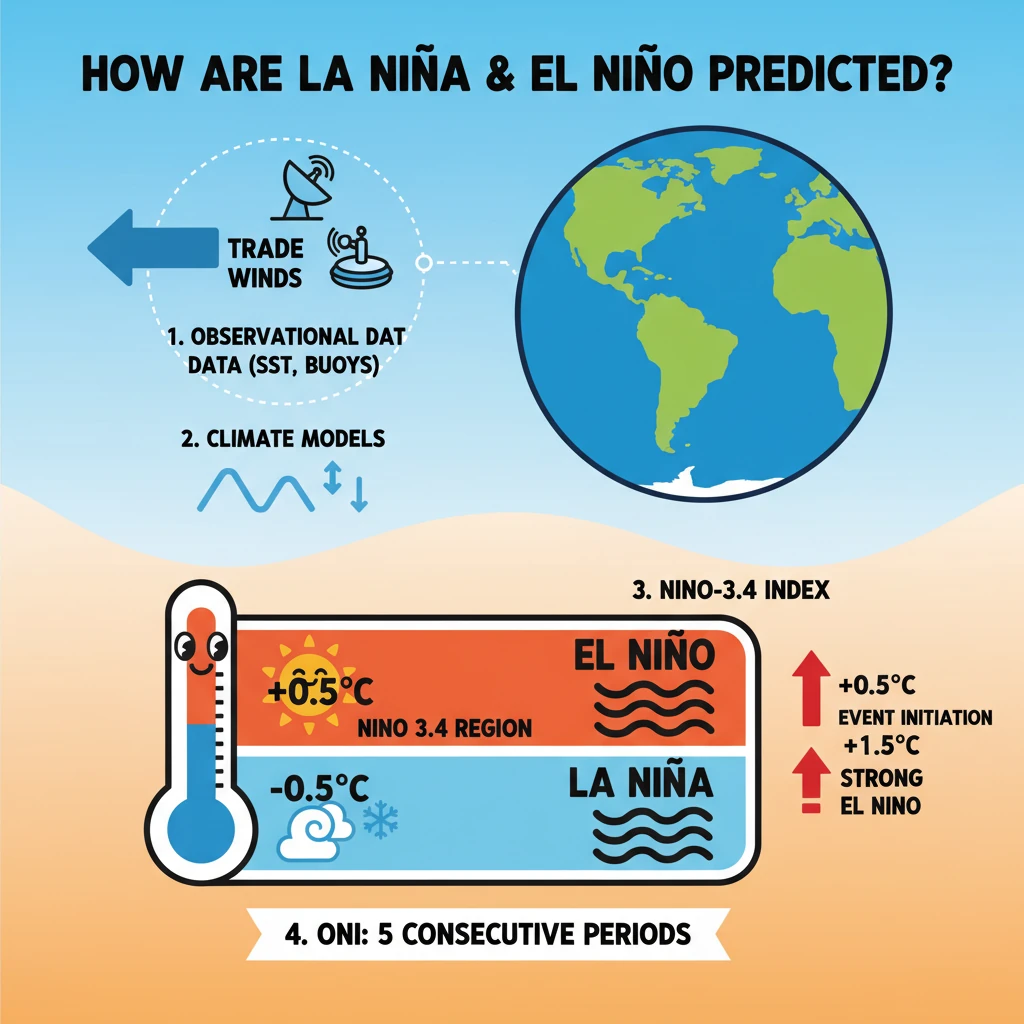
<h4>Understanding ENSO Prediction</h4><p>Scientists employ a combination of <strong>climate models</strong> and extensive <strong>observational data</strong> to forecast the onset and intensity of <strong>ENSO events</strong>, which include both <strong>El Nino</strong> and <strong>La Nina</strong>.</p><p>Accurate predictions are crucial for global planning, especially in sectors like agriculture, water management, and disaster preparedness, given the widespread climatic impacts of these phenomena.</p><h4>Key Observational Data</h4><p>A variety of data sources are continuously monitored to track changes in oceanic and atmospheric conditions that signal an impending <strong>ENSO event</strong>.</p><ul><li><strong>Sea Surface Temperatures (SSTs)</strong>: Crucial for identifying warming (El Nino) or cooling (La Nina) anomalies in the equatorial Pacific.</li><li><strong>Trade Wind Strength</strong>: Changes in these winds are fundamental to the ENSO cycle, influencing ocean currents and temperature distribution.</li><li><strong>Satellite Data</strong>: Provides comprehensive, real-time coverage of ocean temperatures, sea levels, and wind patterns across vast areas.</li><li><strong>Ocean Buoys</strong>: A network of floating devices deployed across the Pacific, offering in-situ measurements of subsurface temperatures, currents, and atmospheric conditions.</li></ul><div class='info-box'><p><strong>Ocean buoys</strong> are instrumental floating devices placed in oceans for various purposes, including continuous environmental monitoring, critical data collection, and aiding navigation. They provide direct measurements that validate satellite observations.</p></div><h4>The Oceanic Nino Index (ONI)</h4><p>The <strong>Oceanic Nino Index (ONI)</strong> is the primary metric used by the U.S. National Oceanic and Atmospheric Administration (NOAA) to identify and classify <strong>El Nino</strong> and <strong>La Nina</strong> events.</p><p>It compares the <strong>3-month running average</strong> of <strong>Sea Surface Temperatures (SSTs)</strong> in the <strong>East-Central Tropical Pacific</strong> (specifically the <strong>Nino 3.4 region</strong>) against a <strong>30-year historical average</strong> for the same period.</p><div class='info-box'><p><strong>ONI Thresholds:</strong></p><ul><li><strong>El Nino</strong>: Occurs when the difference between the 3-month average SST and the 30-year average is <strong>0.5°C or higher</strong> for at least five consecutive overlapping 3-month periods.</li><li><strong>La Nina</strong>: Occurs when the difference is <strong>-0.5°C or lower</strong> for at least five consecutive overlapping 3-month periods.</li></ul></div><h4>The Nino-3.4 Index</h4><p>The <strong>Nino-3.4 Index</strong> specifically refers to the average <strong>Sea Surface Temperature (SST) anomaly</strong> in the <strong>Nino 3.4 region</strong> of the equatorial Pacific (5°N-5°S, 120°-170°W).</p><p>This index is crucial for identifying the initiation and strength of <strong>ENSO events</strong>, providing a more granular look at the core region where these phenomena manifest.</p><div class='info-box'><p><strong>Nino-3.4 Index Thresholds:</strong></p><ul><li>An anomaly value of <strong>0.5°C or greater</strong> typically indicates the initiation of an <strong>El Nino event</strong>.</li><li>A stronger event, often associated with more significant global impacts, is indicated by a temperature anomaly of <strong>1.5°C or more</strong>.</li><li>Conversely, anomalies of <strong>-0.5°C or less</strong> signal the initiation of a <strong>La Nina event</strong>.</li></ul></div><h4>Lead Time for Predictions</h4><p>The ability to predict <strong>ENSO events</strong> varies, with some events offering longer lead times than others due to their specific characteristics and preceding conditions.</p><p>Notably, <strong>La Nina events</strong> that follow a particularly strong <strong>El Nino</strong> can often be forecasted with a significant lead time, sometimes up to <strong>two years in advance</strong>.</p><div class='exam-tip-box'><p>Understanding the <strong>Oceanic Nino Index (ONI)</strong> and <strong>Nino-3.4 Index</strong> is vital for UPSC. These are not just definitions but tools to explain the 'how' of climate prediction, relevant for <strong>GS Paper 1 (Geography)</strong> and <strong>GS Paper 3 (Environment)</strong>.</p></div>
💡 Key Takeaways
- •ENSO prediction uses climate models and observational data (SST, trade winds, satellites, buoys).
- •Oceanic Nino Index (ONI) defines El Nino/La Nina based on 3-month average SST anomalies in East-Central Tropical Pacific (Nino 3.4 region).
- •ONI thresholds: +0.5°C for El Nino, -0.5°C for La Nina (for 5 consecutive periods).
- •Nino-3.4 Index identifies event initiation (0.5°C anomaly) and strength (1.5°C+ for strong El Nino).
- •La Nina following strong El Nino can be predicted up to two years in advance.
- •Accurate ENSO predictions are vital for agriculture, water management, and disaster preparedness globally.
🧠 Memory Techniques
98% Verified Content
📚 Reference Sources
•National Oceanic and Atmospheric Administration (NOAA) Climate Prediction Center
•World Meteorological Organization (WMO) ENSO Updates
•Indian Meteorological Department (IMD) Reports