What are Agriculture Related Findings of Economic Survey 2024-25? - Agriculture Allied Sector | UPSC Learning
Topics
0 topics • 0 completed
🔍
No topics match your search
What are Agriculture Related Findings of Economic Survey 2024-25?
Medium⏱️ 7 min read
agriculture allied sector
📖 Introduction
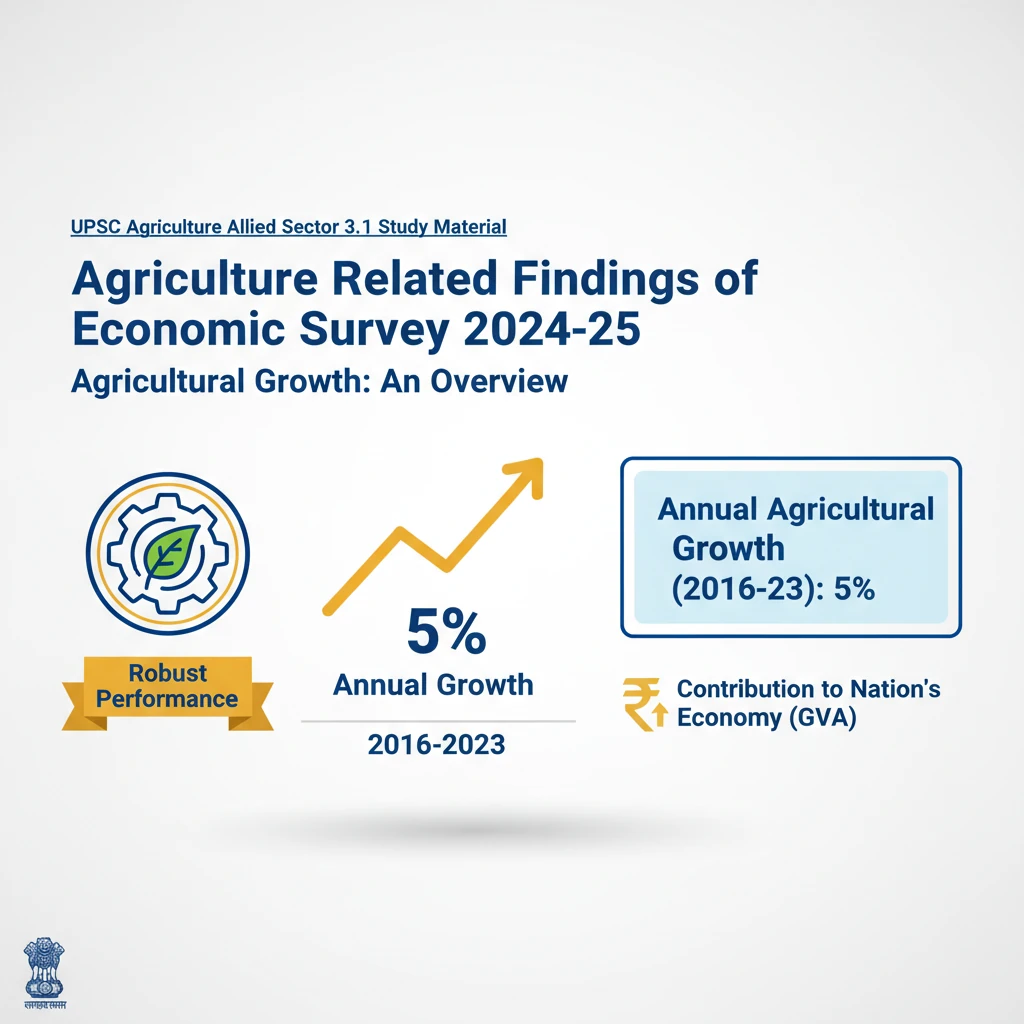
<h4>Agricultural Growth: An Overview</h4><p>The <strong>agriculture sector</strong> has demonstrated robust performance, growing at an impressive <strong>5% annually</strong> between <strong>2016 and 2023</strong>. This consistent growth underscores the sector's resilience and its pivotal role in the Indian economy.</p><div class="info-box"><strong>Annual Agricultural Growth (2016-23):</strong> 5%</div><p>The sector's contribution to the nation's economy, measured by <strong>Gross Value Added (GVA)</strong>, has also significantly increased. Its share rose from <strong>24.38% in 2014-15</strong> to a substantial <strong>30.23% in 2022-23</strong>, highlighting its expanding economic footprint.</p><div class="info-box"><strong>GVA Share of Agriculture:</strong><ul><li><strong>2014-15:</strong> 24.38%</li><li><strong>2022-23:</strong> 30.23%</li></ul></div><p>Furthermore, <strong>agricultural income</strong> has shown a steady upward trajectory, growing at an average rate of <strong>5.23% annually</strong> over the past decade. This indicates improved economic well-being for those dependent on agriculture.</p><div class="key-point-box"><strong>Key Takeaway:</strong> Agriculture is not only growing steadily but also increasing its share in the national GVA, signifying its enhanced importance.</div><h4>Sectoral Performance Highlights</h4><p>Within the broad agriculture sector, certain sub-sectors have exhibited exceptional growth. The <strong>fisheries sector</strong> recorded the highest growth rate, expanding by <strong>13.67%</strong> between <strong>2013-14 and 2022-23</strong>.</p><p>Following closely, the <strong>livestock sector</strong> also showed strong performance, with a growth rate of <strong>12.99%</strong> during the same period. These sectors are crucial for nutritional security and farmer diversification.</p><div class="info-box"><strong>Top Performing Sectors (2013-14 to 2022-23):</strong><ul><li><strong>Fisheries:</strong> 13.67%</li><li><strong>Livestock:</strong> 12.99%</li></ul></div><p>In contrast, the <strong>oilseeds sector</strong> experienced relatively slower growth, with an annual rate of only <strong>1.9%</strong>. This highlights a potential area for policy intervention to boost domestic production and reduce import dependence.</p><div class="exam-tip-box"><strong>UPSC Insight:</strong> Questions often focus on reasons for disparities in sectoral growth and government initiatives to address them. Be prepared to discuss policies related to fisheries, livestock, and oilseeds.</div><h4>Irrigation Coverage and Intensity</h4><p>Significant progress has been made in extending <strong>irrigation coverage</strong> across the country. The proportion of <strong>Gross Cropped Area (GCA)</strong> under irrigation increased from <strong>49.3% in 2015-16</strong> to <strong>55% in 2020-21</strong>.</p><p>Alongside coverage, <strong>irrigation intensity</strong> also improved, rising from <strong>144.2% to 154.5%</strong>. This indicates more efficient and multiple use of irrigated land throughout the year.</p><div class="info-box"><strong>Irrigation Trends:</strong><ul><li><strong>Coverage (GCA):</strong> 49.3% (2015-16) to 55% (2020-21)</li><li><strong>Intensity:</strong> 144.2% to 154.5%</li></ul></div><p>However, there are notable <strong>regional disparities</strong> in irrigation coverage. States like <strong>Punjab (98%)</strong>, <strong>Haryana (94%)</strong>, <strong>Uttar Pradesh (84%)</strong>, and <strong>Telangana (86%)</strong> boast very high irrigation coverage.</p><p>Conversely, states such as <strong>Jharkhand</strong> and <strong>Assam</strong> report irrigation coverage below <strong>20%</strong>. These disparities underscore the need for targeted regional strategies for water resource management.</p><div class="key-point-box"><strong>Definition: Gross Cropped Area (GCA)</strong><br>GCA refers to the total area cultivated in an agricultural year, accounting for all cropping cycles on the same land. If a farmer cultivates wheat and then rice on the same plot in a year, that plot's area is counted twice in GCA.</div>

💡 Key Takeaways
- •Indian agriculture grew 5% annually (2016-23), increasing its GVA share to 30.23% (2022-23).
- •Agricultural income saw 5.23% annual growth over the last decade.
- •Fisheries (13.67%) and Livestock (12.99%) were top-performing sectors.
- •Oilseeds sector showed slow growth at 1.9%, indicating a need for focus.
- •Irrigation coverage increased to 55% of GCA, with intensity rising to 154.5%.
- •Significant regional disparities exist in irrigation, with states like Jharkhand and Assam having very low coverage.
- •The Economic Survey provides crucial data for understanding agricultural trends and policy implications.
🧠 Memory Techniques

95% Verified Content